 |
|
The Xfuzzy 3 development environment | |
|
The graphical representation tool - Xfplot |
|
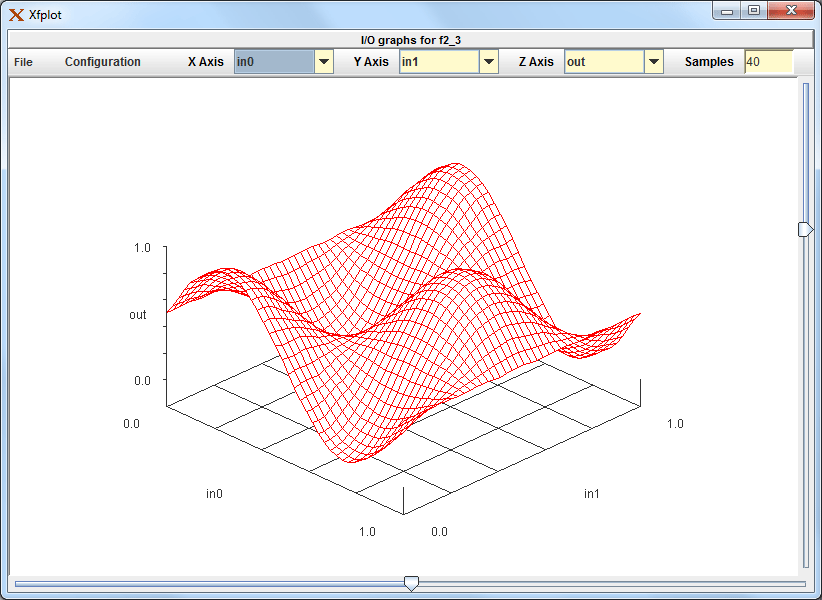
The xfplot tool illustrates the behavior of a fuzzy system by a 2-dimensional or 3-dimensional representation. The tool can be executed from the command line with the expression "xfplot file.xfl", or from the main window of the environment, using the option "Graphical representation" in the Verification menu. The main window of the tool is formed by a central panel, which shows the graphical representation, and an upper bar, dedicated to configuring the representation.  The File menu at the upper bar allows to save the represented data into an external file ("Save Data"), to save the graphical representation as an image (opción "Save image"), to refresh the graphical representation ("Actualize"), and to close the tool ("Close"). The Configuration menu is used to choose the kind of representation ("Plot Mode"), the colors of the plot ("Color Model"), and the values for the input variables ("Input Values"), so as to load a configuration from an external file ("Load Configuration") or to save the configuration into an external file ("Save Configuration"). Three pulldown lists allow the selection of the variables assigned to each axis. The last field contains the number of points used in the partition of the X and Y axis. This is an important parameter because it determines the representation resolution. A low value in this parameter can exclude important details of the system behavior. On the other hand, a high value will make it difficult to understand the represented surface, as it will use a very dense grid. The default value of this parameter is 40. The 3-dimensional representation includes the possibility of rotating the surface by using two sliding buttons at the right and bottom parts of the plot. This rotation capability eases the interpretation of the represented surface.  When choosing a 2-dimensional representation, the central panel changes to show a plain plot wich represents the variation of the output variable selected as Z axis, with respect to the input variable selected as X axis.  When the system under representation contains a number of input variables greater than the required by the kind of representation, it is necessary to introduce the values for the non-selected input variables. This can be done by the option "Input Values", which opens the following window.  |
| |
|
|
|
|
|
|
| |
For comments, patches, bug reports, etc contact us at:
xfuzzy-team@imse-cnm.csic.es
©IMSE-CNM 2018